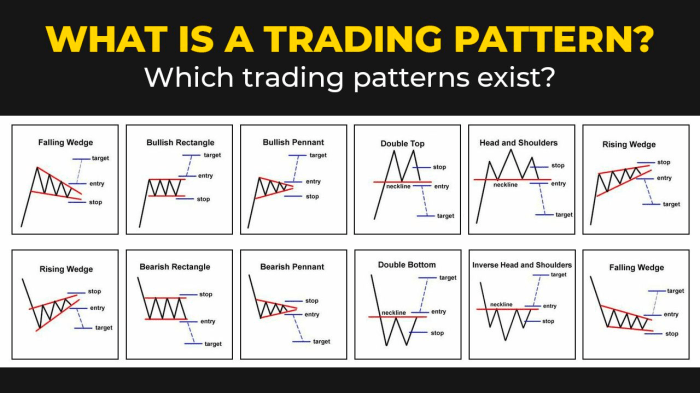
With Technical Analysis in Crypto Trading at the forefront, get ready to dive into the world of crypto with a fresh perspective. From decoding candlestick patterns to analyzing trendlines, this topic is all about maximizing your trading game.
Let’s explore the ins and outs of technical analysis in the crypto market and uncover the secrets to making savvy trading decisions.
Overview of Technical Analysis in Crypto Trading

Technical analysis plays a crucial role in the world of cryptocurrency trading, providing traders with valuable insights into market trends and price movements. By analyzing historical price data and market statistics, traders can make informed decisions about when to buy or sell cryptocurrencies.
Concept of Technical Analysis
Technical analysis involves studying past market data, primarily price and volume, to forecast future price movements. It focuses on chart patterns, trends, and indicators to identify potential trading opportunities.
Main Objectives of Using Technical Analysis
- Identifying trend directions: Technical analysis helps traders determine the direction of a market trend, whether it’s bullish (upward) or bearish (downward).
- Timing entry and exit points: By analyzing price patterns and indicators, traders can pinpoint optimal entry and exit points for their trades.
- Managing risk: Technical analysis enables traders to set stop-loss orders and manage their risk effectively by identifying key support and resistance levels.
Importance of Technical Analysis in Crypto Trading
- Decision-making: Technical analysis aids traders in making informed decisions based on data and market trends, rather than relying solely on emotions or speculation.
- Market psychology: By understanding market psychology and investor behavior through technical analysis, traders can anticipate price movements and react accordingly.
- Enhanced performance: Utilizing technical analysis tools can lead to improved trading performance and increased profitability in the volatile crypto market.
Common Technical Analysis Tools in Crypto Trading

Technical analysis tools are essential for traders in the crypto market to make informed decisions. These tools help analyze price movements and identify potential trends, allowing traders to capitalize on market opportunities.
Moving Averages
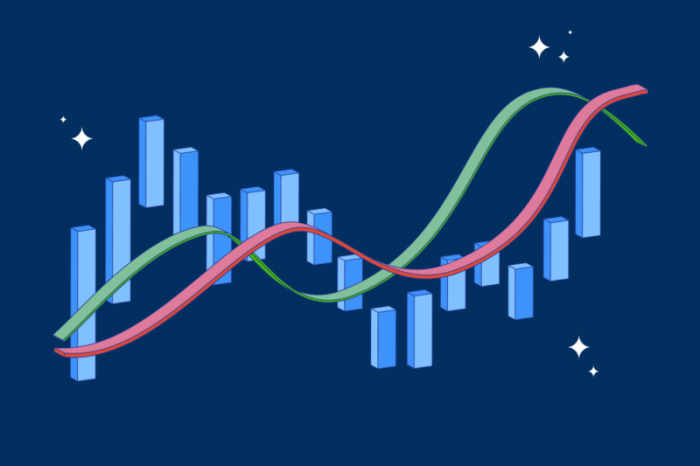
Moving averages are one of the most widely used technical indicators in crypto trading. They smooth out price data to create a single trend-following line, making it easier to identify trends. Traders often use the crossover of short-term (faster) and long-term (slower) moving averages to signal buying or selling opportunities.
Relative Strength Index (RSI)
The Relative Strength Index (RSI) is a momentum oscillator that measures the speed and change of price movements. It ranges from 0 to 100 and is used to identify overbought or oversold conditions in the market. A reading above 70 indicates overbought conditions, while a reading below 30 indicates oversold conditions.
Moving Average Convergence Divergence (MACD), Technical Analysis in Crypto Trading
The Moving Average Convergence Divergence (MACD) is a trend-following momentum indicator that shows the relationship between two moving averages of an asset’s price. Traders look for MACD line crossovers to identify potential buy or sell signals. Additionally, the MACD histogram can indicate the strength of a trend.
Candlestick Patterns and Chart Analysis

When it comes to technical analysis in crypto trading, candlestick patterns play a crucial role in helping traders understand market sentiment and predict potential price movements. These patterns, formed by the open, high, low, and close prices of a cryptocurrency within a specific time frame, provide valuable insights into market dynamics.
Significance of Candlestick Patterns
Candlestick patterns are visual representations of price movements that help traders identify potential trend reversals, continuations, or indecision in the market. By analyzing these patterns, traders can make informed decisions on when to enter or exit a trade, thus improving their chances of profitability.
Interpretation of Common Candlestick Patterns
- Doji: A doji candlestick indicates market indecision, with the open and close prices being very close to each other. Traders often see this pattern as a potential reversal signal.
- Hammer: The hammer candlestick has a small body and a long lower wick, suggesting a potential bullish reversal after a downtrend.
- Engulfing Patterns: Bullish engulfing patterns occur when a large green candlestick engulfs the previous red candlestick, indicating a potential bullish reversal. Conversely, bearish engulfing patterns suggest a potential bearish reversal.
Using Candlestick Patterns for Price Predictions
Traders can use candlestick patterns in conjunction with other technical indicators to predict potential price reversals or continuations in the crypto market. By recognizing these patterns and understanding their implications, traders can make more informed trading decisions and improve their overall profitability.
Trend Analysis and Support/Resistance Levels: Technical Analysis In Crypto Trading
Trend analysis and support/resistance levels are essential components of technical analysis in crypto trading, helping traders to make informed decisions based on price movements.
Trend Analysis in Cryptocurrency
Trend analysis involves identifying the direction in which the price of a cryptocurrency is moving. Traders use trendlines to connect the highs or lows of price movements over a period, helping them determine whether the price is trending upwards (bullish) or downwards (bearish). By recognizing trends, traders can make better decisions on when to enter or exit trades.
- Trendlines are drawn by connecting consecutive lows in an uptrend or highs in a downtrend.
- An uptrend is formed when higher highs and higher lows are consistently observed on the chart.
- A downtrend occurs when lower highs and lower lows are prevalent in the price movements.
Support and Resistance Levels
Support and resistance levels are key areas on a price chart where the price tends to pause, reverse, or continue its movement. Support represents a price level where buying interest is strong enough to prevent the price from falling further, while resistance signifies a level where selling pressure is sufficient to halt a price increase.
- Support levels can be identified as previous lows where the price has bounced back upwards.
- Resistance levels are formed at previous highs where the price has struggled to break through.
- Traders often use these levels to set stop-loss orders or take-profit targets.
Understanding trend analysis and support/resistance levels can help traders anticipate potential price movements and make strategic decisions in their crypto trading activities.


